Technical analysis examines past price movements to identify patterns that traders can use to predict future price movements. Technical analysts all share the belief that all relevant information is reflected in price movement, with no need to look at other factors such as economic indicators or company financials.
Different techniques that traders can use in technical analysis
Traders can use many different techniques in technical analysis, but some of the most popular ones are support and resistance levels, moving averages and trend lines. Technical analysts will often use multiple techniques to get a complete picture of what is happening in the market.
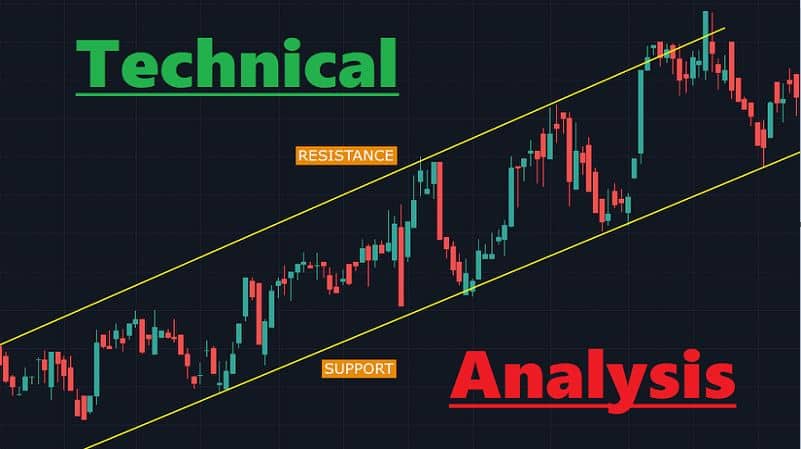
Support and resistance levels
are crucial technical analysis tools that traders can use to identify potential turning points in the market. Support levels are prices at which demand is thought to be strong enough to prevent the price from falling any further. Resistance levels are prices at which supply is thought to be strong enough to prevent the price from rising any further.
Trend lines
Trend lines are another popular technical analysis tool that traders can use to identify potential support and resistance levels. A trend line is a graph or line drawn on a chart that connects two or more price points.
Moving averages
Moving averages are another commonly used technical analysis tool that can help smooth out short-term price movements and make it easier to identify longer-term trends.
Strengths of technical analysis
One of the main strengths of technical analysis is that it can be used in any time frame, from very short-term charts to long-term charts. This flexibility can be helpful for traders who want to trade on different time frames or for investors who want to take a longer-term view of the market.
Another strength of the technical analysis is that it is not reliant on any particular piece of data or information and can be used in conjunction with other types of analysis, such as fundamental analysis, to get a complete picture of what is happening in the market.
Weaknesses of technical analysis
One of the main weaknesses of technical analysis is that it is based on the assumption that all relevant information is reflected in price movements, which may not always be the case. There have been instances where important news events have caused prices to move in a direction that was not anticipated by technical analysis.
Another weakness of technical analysis is that it can be challenging to identify which technical indicators are the most important and should always be given the most weight, leading to traders and investors using too many indicators, making it challenging to interpret the data.
Why do UK traders use technical analysis?
Technical analysis is a popular tool among UK traders as they can use it to identify potential turning points in the market. Support and resistance levels can identify potential support and resistance levels. At the same time, trend lines and moving averages can help smooth out short-term price movements and make it easier to spot longer-term trends.
Technical analysis can also be used in conjunction with other types of analysis, such as fundamental analysis, to get a complete picture of what is happening in the market.
In conclusion
Technical analysis has both strengths and weaknesses, but it can be a valuable tool for traders and investors who want to understand price movements in the market better. It is important to remember that technical analysis should not be used in isolation but rather in conjunction with other types of analysis, such as fundamental analysis.
Novice traders who want to buy stocks online uk are advised to contact an experienced and reliable online broker such as Saxo Bank. By trading on the Saxo demo account, you can practise different trading strategies and learn to use technical analysis before investing your money.


